Significato della parola "Gantt chart" in italiano
Cosa significa "Gantt chart" in inglese? Scopri il significato, la pronuncia e l'uso specifico di questa parola con Lingoland
Gantt chart
US /ˈɡænt tʃɑːrt/
UK /ɡænt tʃɑːt/
Sostantivo
diagramma di Gantt
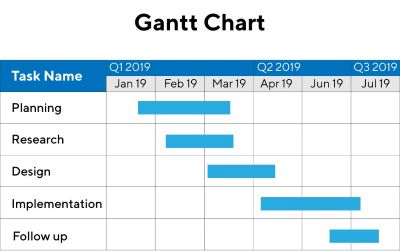
a chart in which a series of horizontal lines shows the amount of work done or completed in certain periods of time in a project
Esempio:
•
The project manager used a Gantt chart to visualize the project timeline and task dependencies.
Il project manager ha utilizzato un diagramma di Gantt per visualizzare la tempistica del progetto e le dipendenze delle attività.
•
Creating a detailed Gantt chart helps in effective project planning and tracking.
Sinonimo:
Parola Correlata: