Meaning of the word "pie chart" in English
What does "pie chart" mean in English? Explore the meaning, pronunciation, and specific usage of this word with Lingoland.
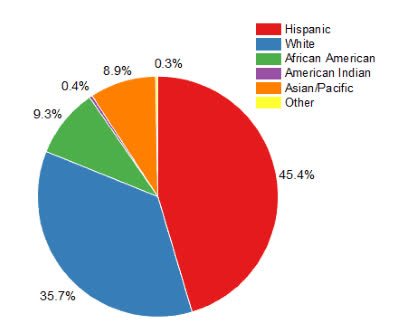
pie chart
US /ˈpaɪ ˌtʃɑːrt/
UK /ˈpaɪ ˌtʃɑːt/
Noun
a type of graph in which a circle is divided into sectors that each represent a proportion of the whole
Example:
•
The report included a pie chart showing the distribution of expenses.
•
We used a pie chart to visualize the market share of different companies.
Synonym:
Related Word: