Bedeutung des Wortes "block graph" auf Deutsch
Was bedeutet "block graph" auf Englisch? Erfahren Sie mit Lingoland die Bedeutung, Aussprache und spezifische Verwendung dieses Wortes
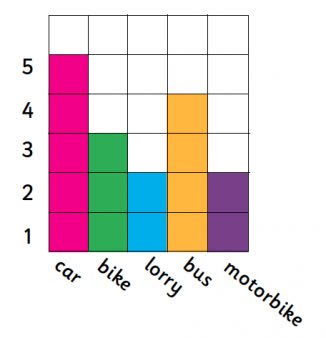
block graph
US /ˈblɑːk ˌɡræf/
UK /ˈblɒk ˌɡrɑːf/
Substantiv
Blockdiagramm
a graph that uses blocks to represent data, where each block typically represents one unit or a specific quantity, often used for simple data visualization.
Beispiel:
•
The teacher showed the students how to create a block graph to display the number of pets each student owned.
Der Lehrer zeigte den Schülern, wie man ein Blockdiagramm erstellt, um die Anzahl der Haustiere jedes Schülers darzustellen.
•
We used a block graph to compare the favorite colors of the class.
Wir haben ein Blockdiagramm verwendet, um die Lieblingsfarben der Klasse zu vergleichen.
Synonym:
Verwandtes Wort: